- 필요한 모듈 가져오기
# 하버사인 공식
# 두 지접의 위도와 경도를 입력하면 거리를 구해주는 모듈
!pip install haversine

!pip install pandasecharts

import pandas as pd
from haversine import haversine  # 두 지점 간의 거리 계산
import IPython  # 상호작용적인 컴퓨터 환경 제공
from pandasecharts import echart  # 데이터프레임 시각화(차트)
from pyecharts.charts import Timeline, Grid
- 사용할 데이터 읽어오기
더보기
결과

결과
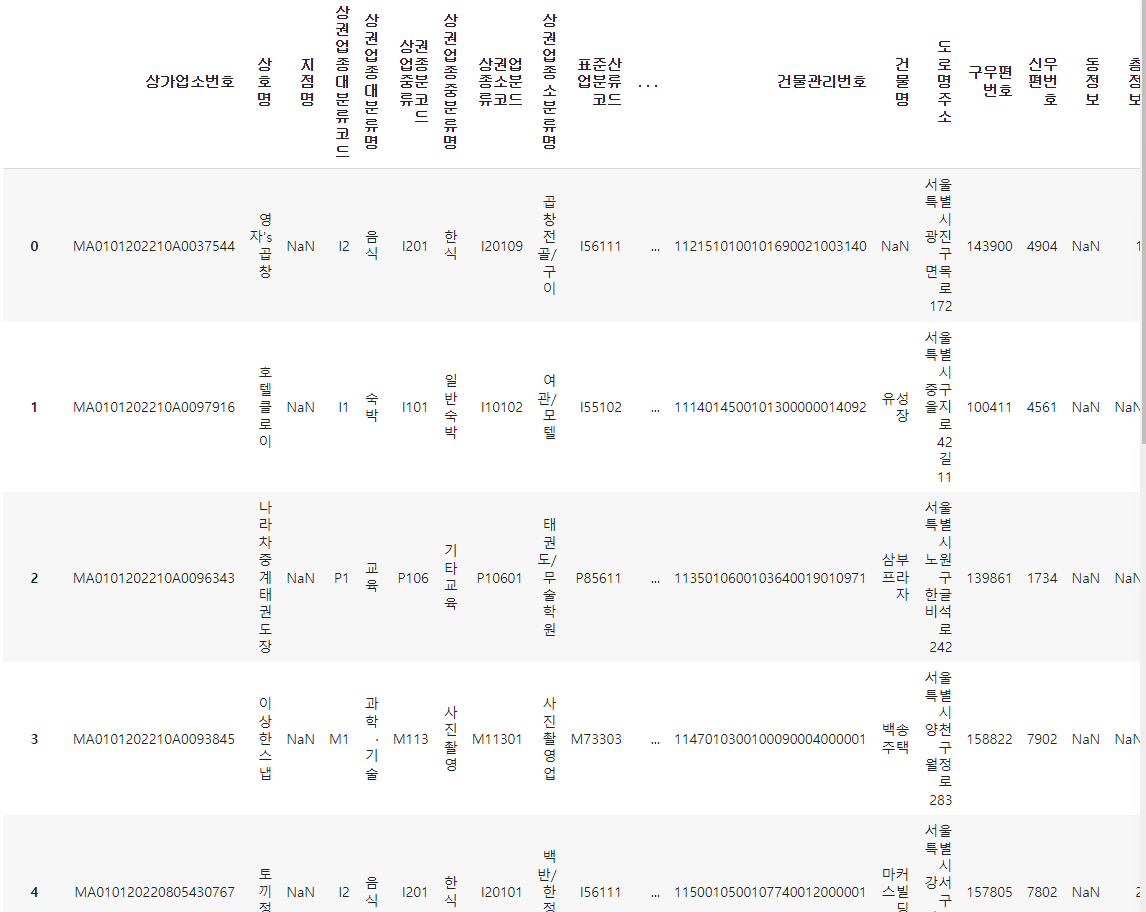
df = pd.read_csv("파일경로")
df
df.info()
- 원하는 데이터만 저장하기
더보기

결과

결과

결과

결과
결과

결과
결과

결과

결과

결과

결과
결과
결과
shop = ["엽기떡볶이", "죠스떡볶이", "신전떡볶이", "청년다방", "감탄떡볶이"]
사용할 떡볶이 프랜차이즈 선택하기
# 파리바게트(파리바게뜨) 데이터 필터링
# contains(): 특정 문자열 포함 여부에 따라 True, False를 반환
data = df["상호명"].str.contains("파리바게트|파리바게뜨")
df_paris = df.loc[data, ["상가업소번호", "상호명", "경도", "위도"]].copy()
df_paris
필요한 데이터만 골라서 copy 한다.
df_paris = df_paris.set_axis(["업소번호", "업소상호명", "업소경도", "업소위도"], axis=1).reset_index(drop=True)
df_paris
인덱스를 설정해 준다.
# 떡볶이 프렌차이즈 데이터 필터링
df_shop = df.copy()

# 상가업소번호, 상호명, 시군구명, 경도, 위도
# extract(): 특정 문자열을 포함하고 있으면 그 문자열을 반환하고, 포함하지 않으면 NaN을 반환
# "엽기떡볶이|조쇼떡볶이|신전떡볶이|청년다방|감탄떡볶이"
df_shop["상호명"] = df_shop["상호명"].str.extract("({})".format('|'.join(shop)))[0]

df_shop = df_shop.dropna(subset=["상호명"]).iloc[:, [0, 1, 14, 37, 38]].reset_index(drop=True)
df_shop
떡볶이 프랜차이즈 필터링 후 인덱스 설정.
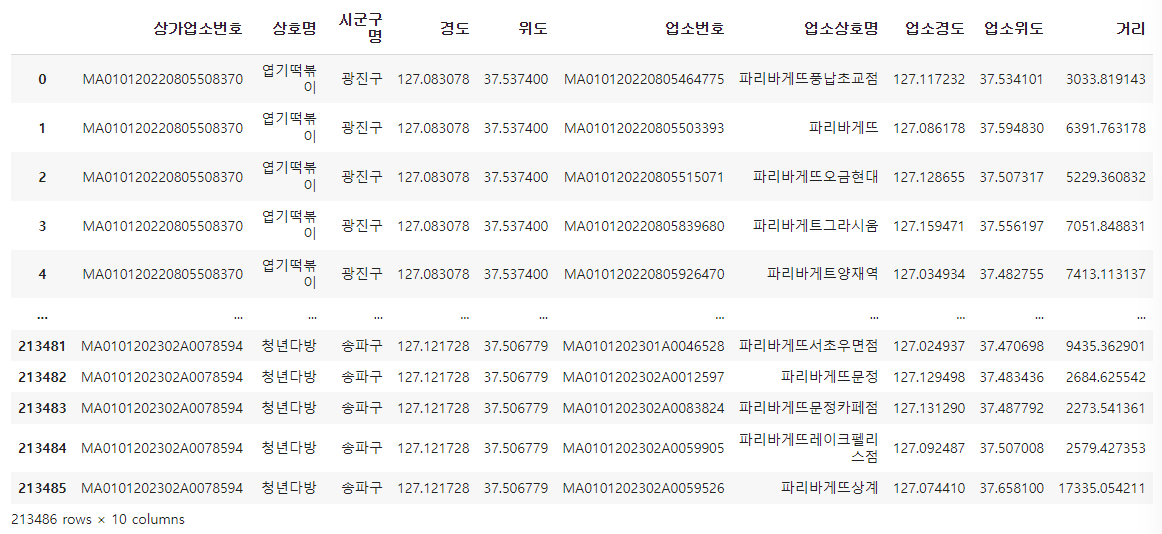
# 떡볶이 프렌차이즈, 파리바게트 곱집합
df_cross = df_shop.merge(df_paris, how="cross")
df_cross
# 떡볶이 프렌차이즈와 파리바게트 사이의 거리 구하기
df_cross['거리'] = df_cross.apply(lambda x: haversine([x['위도'], x['경도']], [x['업소위도'], x['업소경도']], unit='m'), axis=1)
df_cross
# 개별 떡볶이 매장과 파리바게트와의 최소 거리
df_dis = df_cross.groupby(["상가업소번호", "상호명"])["거리"].min().reset_index()
df_dis
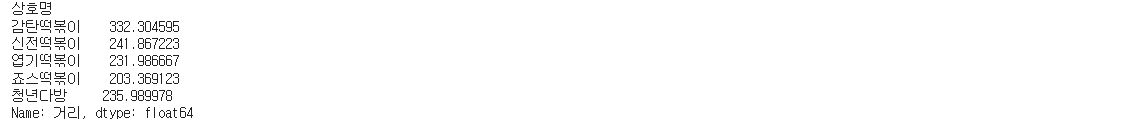
# 각 프렌차이즈 별 파리바게트와의 평균 거리
df_dis.groupby("상호명")["거리"].mean()
# agg(): 다중집계작업을 간단하게 해주는 함수
df_dis.groupby("상호명")["거리"].agg(["mean", "count"])
# 거리를 입력하면 프렌차이즈 별 파리바게트와의 평균거리와 매장개수를 출력하는 함수
def distance(x):
  dis = df_dis["거리"] <= x
  return df_dis[dis].groupby("상호명")["거리"].agg(["mean", "count"])

distance(50)
# 거리가 100m 이하인 매장, 인덱스 생성
df_100 = distance(100).reset_index()
df_100
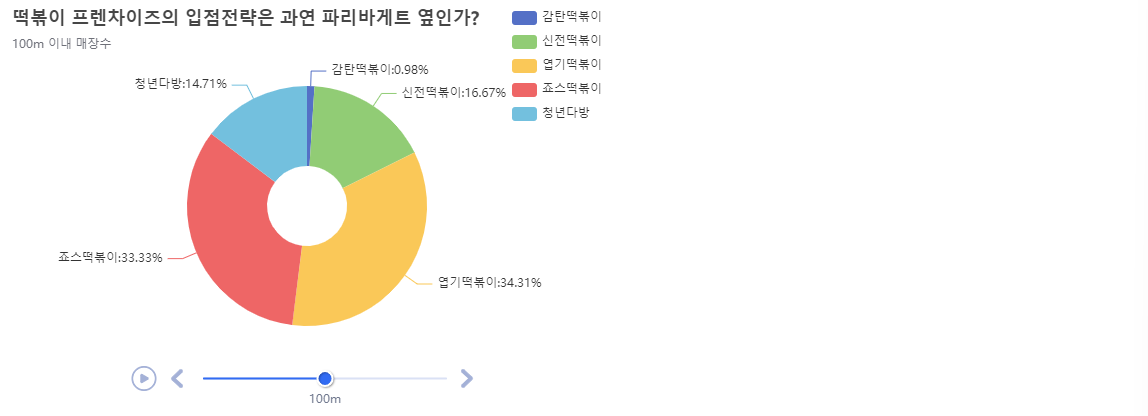
# df_100 데이터 차트로 나타내기
df_100.echart.pie(x="상호명", y="count", figsize=(600, 400), radius=["20%", "60%"],
                  label_opts={"position":"outer"}, title="떡볶이 프렌차이즈의 입점전략은 과연 파리바게트 옆인가?",
                  legend_opts={"pos_right":"0%", "orient":"vertical"},
                  subtitle="100m 이내 매장수").render()

IPython.display.HTML(filename="render.html")  # HTML 파일을 시각화하여 보여줌
# 타임라인 추가하기
tl = Timeline({'width': '600px', 'height': '400px'})
pie1 =df_100.echart.pie(x='상호명', y='count', figsize=(600, 400),
                  radius=['20%', '60%'], label_opts={'position':'outer'},
                  title='떡볶이 프렌차이즈의 입점전략은 과연 파리바게트 옆인가?',
                  legend_opts={'pos_right':'0%', 'orient':'vertical'},
                  subtitle='100m 이내 매장수')
tl.add(pie1, '100m').render()
IPython.display.HTML(filename='render.html')
# 거리별 타임라인 설정하기
tl = Timeline({"width":"600px", "height":"400px"})
for i in [1000, 100, 50, 30]:
  df_d = distance(i).reset_index()
  pie1 = df_d.echart.pie(x="상호명", y="count", figsize=(600, 400), radius=["20%", "60%"],
                    label_opts={"position":"outer"}, title="떡볶이 프렌차이즈의 입점전략은 과연 파리바게트 옆인가?",
                    legend_opts={"pos_right":"0%", "orient":"vertical"},
                    subtitle="{}m 이내 매장수".format(i))
  tl.add(pie1,"{}m".format(i)).render()
IPython.display.HTML(filename="render.html")'Python > 데이터분석' 카테고리의 다른 글
| Python 서울시 따릉이 API 활용 (0) | 2024.06.03 |
|---|---|
| Python 전국 도시공원 데이터 (0) | 2024.05.28 |
| Python seaborn, folium, 상권별 업종 밀집 통계 데이터 (0) | 2024.05.28 |
| Python 가상 온라인 쇼핑몰 데이터 (0) | 2024.05.28 |
| Python MatPlotlib (0) | 2024.05.27 |