- 필요한 모듈 가져오기
import pandas as pd
- 사용할 데이터를 읽어오기
더보기
결과

결과
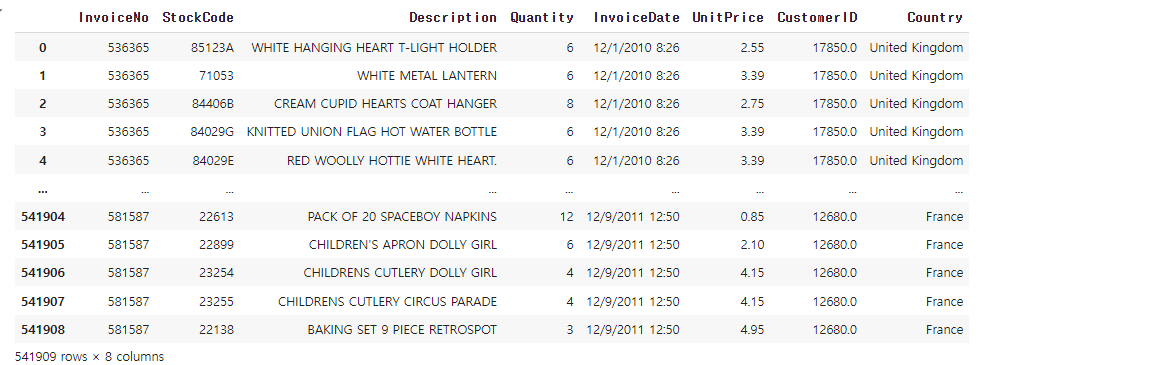
retail = pd.read_csv("데이터 경로")
retail
retail.info()
읽어온 파일의 정보를 소개해준다.
- 원하는 데이터만 저장하기
더보기

결과

결과
결과
수량이 1이상인 데이터 결과

가격이 0초과인 데이터 결과

결과
# 각 컬럼당 null이 몇개 있는지 확인
retail.isnull().sum()
# 비회원/탈퇴/휴면회원 제거
retail = retail[pd.notnull(retail["CustomerID"])]
retail
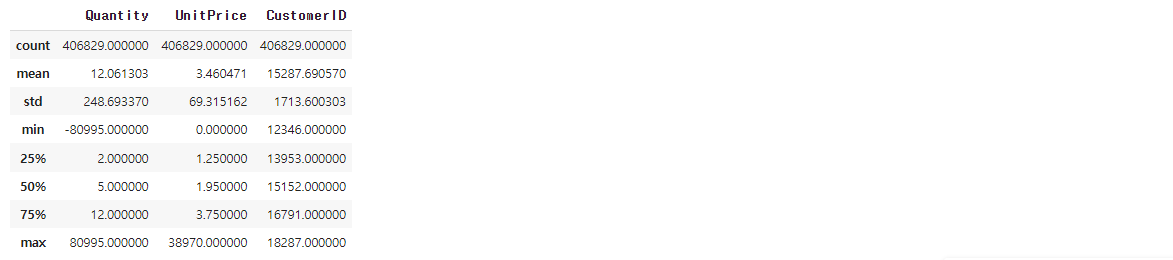
# 데이터 프레임 요약 통계 정보 출력
retail.describe()
# 구입 수량이 0 또는 0 이하인 데이터를 확인
retail[retail["Quantity"] <= 0]
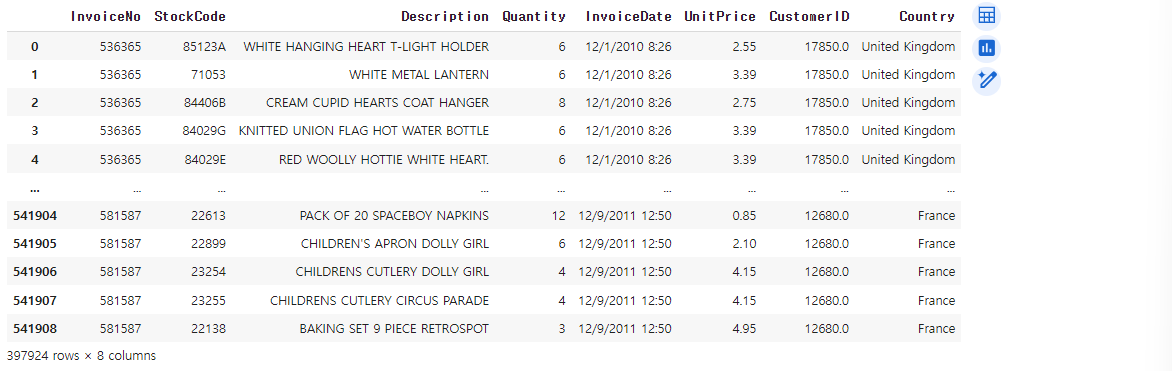
# 구입 수량이 1이상인 데이터만 저장
retail = retail[retail["Quantity"] >= 1]
# 구입 가격이 0 또는 0이하인 데이터를 확인
retail[retail["UnitPrice"] <= 0]

# 구입 가격이 0초과인 데이터만 저장
retail = retail[retail["UnitPrice"] > 0]
# 고객의 총 지출비용 파생변수 만들기
# 총 지출비용(CheckoutPrice) = 가격(UnitPrice) * 수량(Quantity)
retail["CheckoutPrice"] = retail["UnitPrice"] * retail["Quantity"]
retail.head()
- 데이터 타입 바꾸기
더보기

결과
retail["InvoiceDate"] = pd.to_datetime(retail["InvoiceDate"])

retail.info()
- 전체 매출, 나라별 구매 횟수, 국가별 매출, 월별 매출, 요일별 매출, 시간대별 구하기
더보기

결과

결과

결과
그래프

결과

결과

결과

결과
결과

결과
결과
# 전체 매출
total_revenue = retail["CheckoutPrice"].sum()
total_revenue
# 각 나라별 구매 횟수
# pd.options.display.max_rows = 50
# retail.groupby("Country")["Quantity"].count() 이것도 됨
retail["Country"].value_counts()
- 국가별 매출
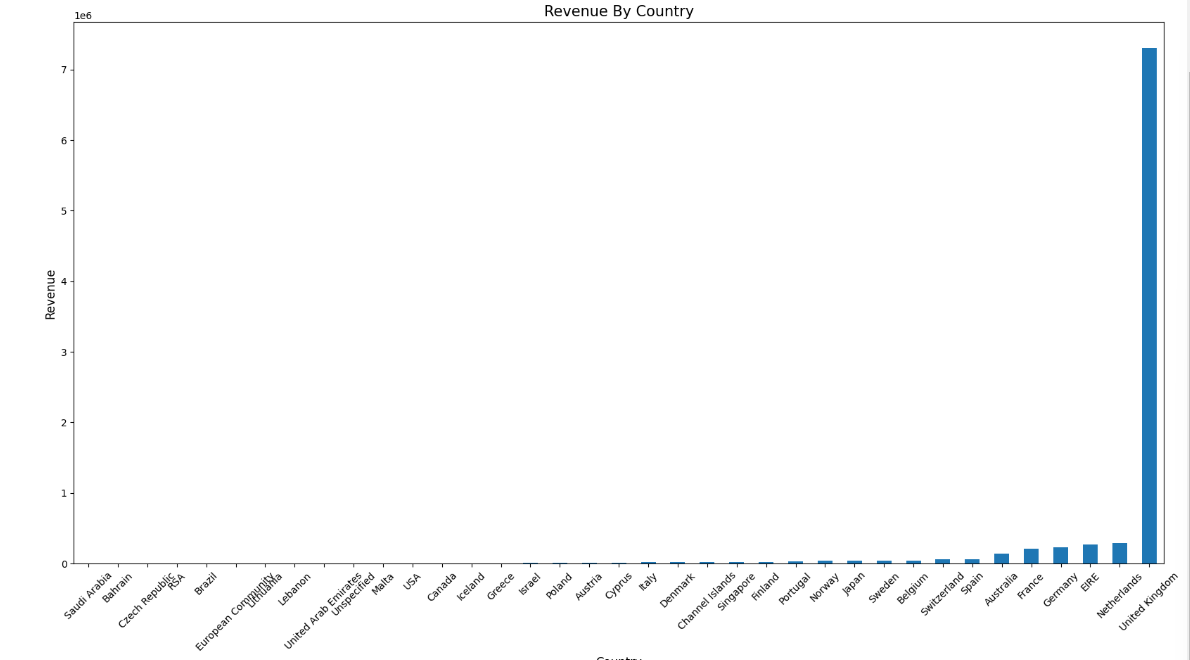
# 국가별 매출
rev_by_countries = retail.groupby("Country")["CheckoutPrice"].sum().sort_values()
rev_by_countries
# 국가별 매출에 따른 막대그래프
plot = rev_by_countries.plot(kind="bar", figsize=(20, 10))
plot.set_xlabel("Country", fontsize=12)
plot.set_ylabel("Revenue", fontsize=12)
plot.set_title("Revenue By Country", fontsize=15)
plot.set_xticklabels(labels=rev_by_countries.index, rotation=45)
- 월별 매출
# 월별 매출 구하기
def extract_month(date):    # 2010-12-01 08:26:00
  month = str(date.month)   # 12
  if date.month < 10:
    month = '0' + month     # 예) 2월인 경우 02
  return str(date.year) + month   # 201112, 201101


  rev_by_month = retail.set_index("InvoiceDate").groupby(extract_month)["CheckoutPrice"].sum()

  rev_by_month
# 막대그래프로 나타내기
def plot_bar(df, xlabel, ylabel, title, titlesize=15, fontsize=12, rotation=45, figsize=(20, 10)):
  plot = df.plot(kind="bar", figsize=figsize)
  plot.set_xlabel(xlabel, fontsize=fontsize)
  plot.set_ylabel(ylabel, fontsize=fontsize)
  plot.set_title(title, fontsize=titlesize)
  plot.set_xticklabels(labels=df.index, rotation=rotation)


plot_bar(rev_by_month, "Month", "Revenue", "Revenue By Month")
- 요일별 매출
# 요일별 매출 구하기
def extract_dow(date):
  return date.dayofweek


# rev_by_dow = retail.set_index("InvoiceDate").groupby(extract_dow)["CheckoutPrice"].sum()
rev_by_dow = retail.set_index("InvoiceDate").groupby(lambda date: date.dayofweek)["CheckoutPrice"].sum()
rev_by_dow
import numpy as np  # 요일 배열을 위해 import

DAY_OF_WEEK = np.array(["Mon", "Tue", "Web", "Thur", "Fri", "Sat", "Sun"])
rev_by_dow.index = DAY_OF_WEEK[rev_by_dow.index]
rev_by_dow
# 막대그래프로 나타내기
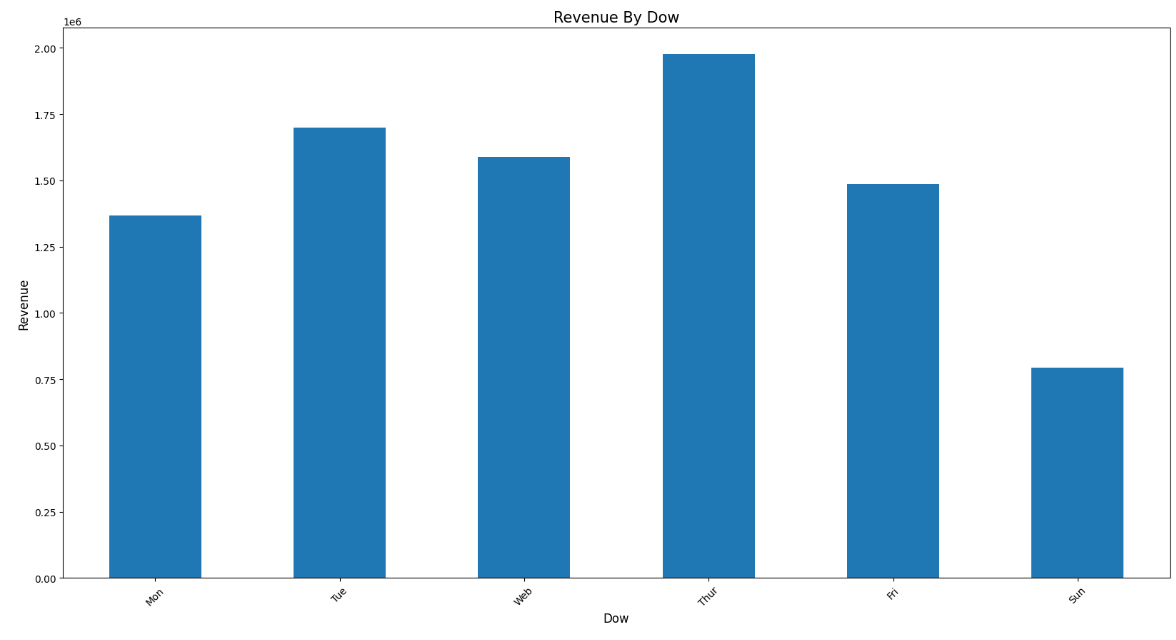
plot_bar(rev_by_dow, "Dow", "Revenue", "Revenue By Dow")
- 시간대별 매출
# 시간대별 매출 구하기
rev_by_hour = retail.set_index("InvoiceDate").groupby(lambda date: date.hour)["CheckoutPrice"].sum()
rev_by_hour
# 막대그래프로 나타내기
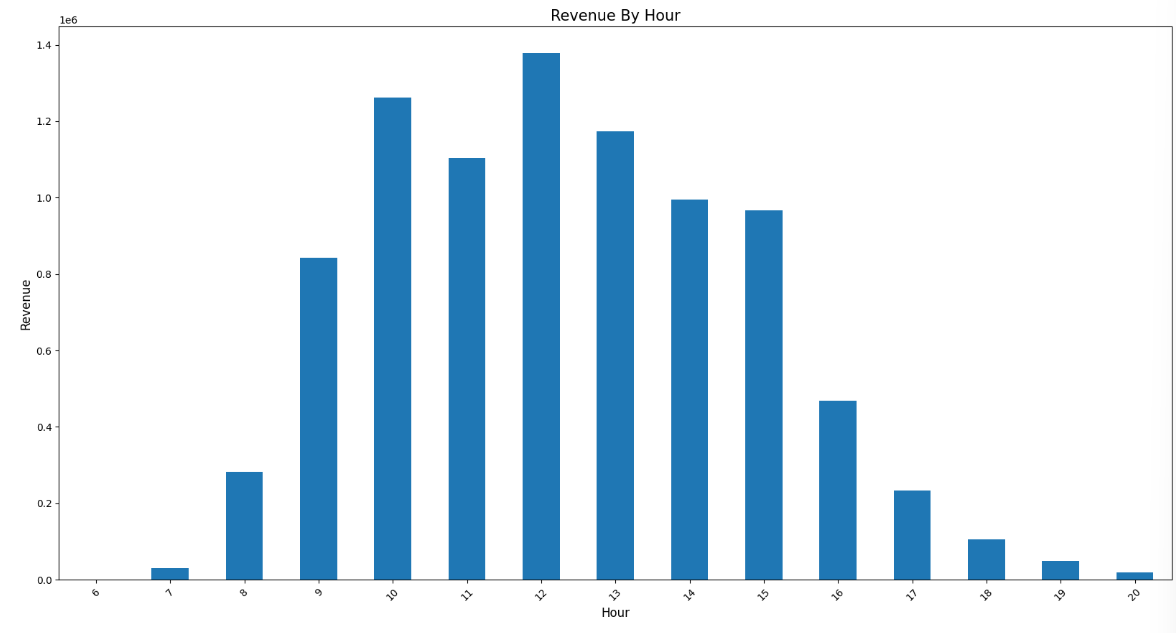
plot_bar(rev_by_hour, "Hour", "Revenue", "Revenue By Hour")
- 데이터로부터 Insight
- 전체 매출의 약 82%가 UK에서 발생
- 매출은 꾸준히 성장하는 것으로 보임(11년 12월 데이터는 9일까지만 포함)
- 토요일은 영업을 하지 않음
- 새벽 6시에 오픈, 오후 9시에 마감이 예상
- 일주일 중 목요일까지는 성장세를 보이고 이후 하락
- 추가 문제
더보기
결과

결과
-
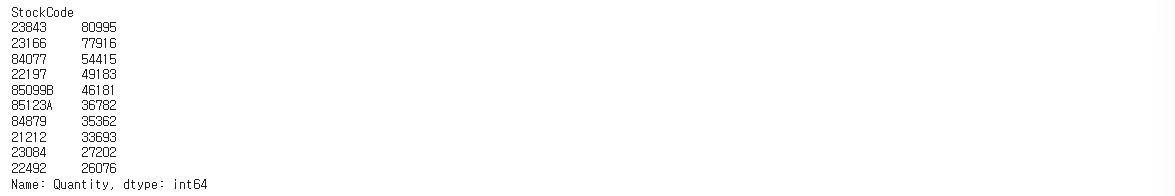
판매제품(StockCode) Top 10 (단, 기준은 Quantitiy)
top_selling = retail.groupby("StockCode")["Quantity"].sum().sort_values(ascending=False)[:10]
top_selling
-
우수 고객(CustomerId) Top 10 (단, 기준은 CheckoutPrice)
vvip = retail.groupby("CustomerID")["CheckoutPrice"].sum().sort_values(ascending=False).head(10) # 인덱스가 실수여서 [:10]은 안됨
vvip
'Python > 데이터분석' 카테고리의 다른 글
| Python 전국 도시공원 데이터 (0) | 2024.05.28 |
|---|---|
| Python seaborn, folium, 상권별 업종 밀집 통계 데이터 (0) | 2024.05.28 |
| Python MatPlotlib (0) | 2024.05.27 |
| Python 넘파이(Numpy) (0) | 2024.05.22 |
| Python 셀레니움 (0) | 2024.05.22 |