- 필요한 모듈 가져오기
import requests
import folium
import json
import pandas as pd
import warnings
warnings.filterwarnings("ignore")
- 데이터 요청하기
더보기

결과
# 따릉이 API: https://www.bikeseoul.com/app/station/getStationRealtimeStatus.do
targetSite = "https://www.bikeseoul.com/app/station/getStationRealtimeStatus.do"
request = requests.post(targetSite, data = {"stationGrpSeq":"ALL"})
print(request)
#  print(request.text)
- 데이터 처리하기
더보기

결과

결과
결과

dtypes에 결과
결과
결과
- json 데이터 처리
# json.loads(): json 타입의 문자열 데이터를 파이썬에서 처리할 수 있도록 변환(딕셔너리로 변환)

bike_json = json.loads(request.text)
print(bike_json)
print(type(bike_json))
- 데이터프레임으로 변환
# json_normalize(): 딕셔너리의 타입의 데이터를 판다스 데이터프레임으로 변환한다.

bike_df = pd.json_normalize(bike_json, "realtimeList")
bike_df
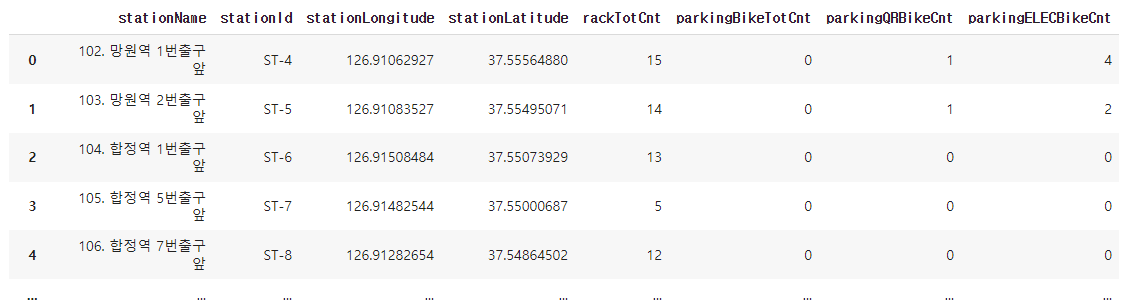
- 원하는 데이터 저장
# 원하는 컬럼만 사용하기
bike_df_map = bike_df[["stationName", "stationId", "stationLongitude", "stationLatitude",
                      "rackTotCnt", "parkingBikeTotCnt", "parkingQRBikeCnt", "parkingELECBikeCnt"]]
bike_df_map
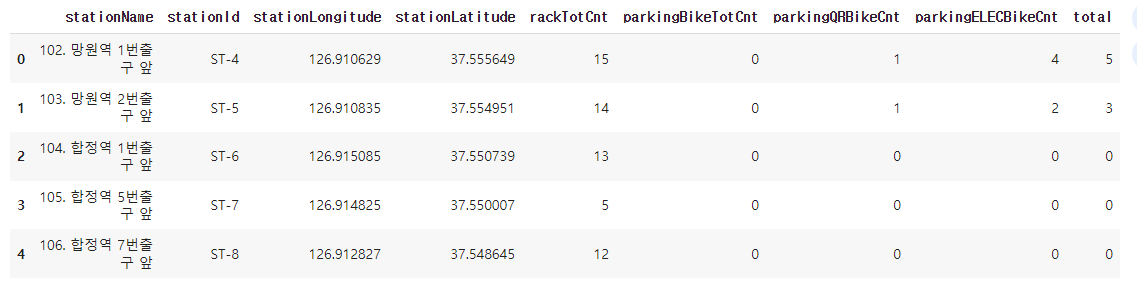
- 데이터 타입 변경 및 파생변수 만들기
# 위도, 경도 -> float 변환
bike_df_map["stationLongitude"] = bike_df_map["stationLongitude"].astype(float)
bike_df_map["stationLatitude"] = bike_df_map["stationLatitude"].astype(float)

# 추자할 수 있는 자전거 대수, 주차된 자전거 총 대수, 주차된 QR자전거 총 대수, 주차된 새싹 자전거 총 대수 -> int
bike_df_map["rackTotCnt"] = bike_df_map["rackTotCnt"].astype(int)
bike_df_map["parkingBikeTotCnt"] = bike_df_map["parkingBikeTotCnt"].astype(int)
bike_df_map["parkingQRBikeCnt"] = bike_df_map["parkingQRBikeCnt"].astype(int)
bike_df_map["parkingELECBikeCnt"] = bike_df_map["parkingELECBikeCnt"].astype(int)

# 파생변수 만들기[total]
# 따릉이 + QR + 새싹
bike_df_map["total"] = bike_df_map["parkingBikeTotCnt"] + bike_df_map["parkingQRBikeCnt"] + bike_df_map["parkingELECBikeCnt"]

# bike_df_map.dtypes
bike_df_map.head()
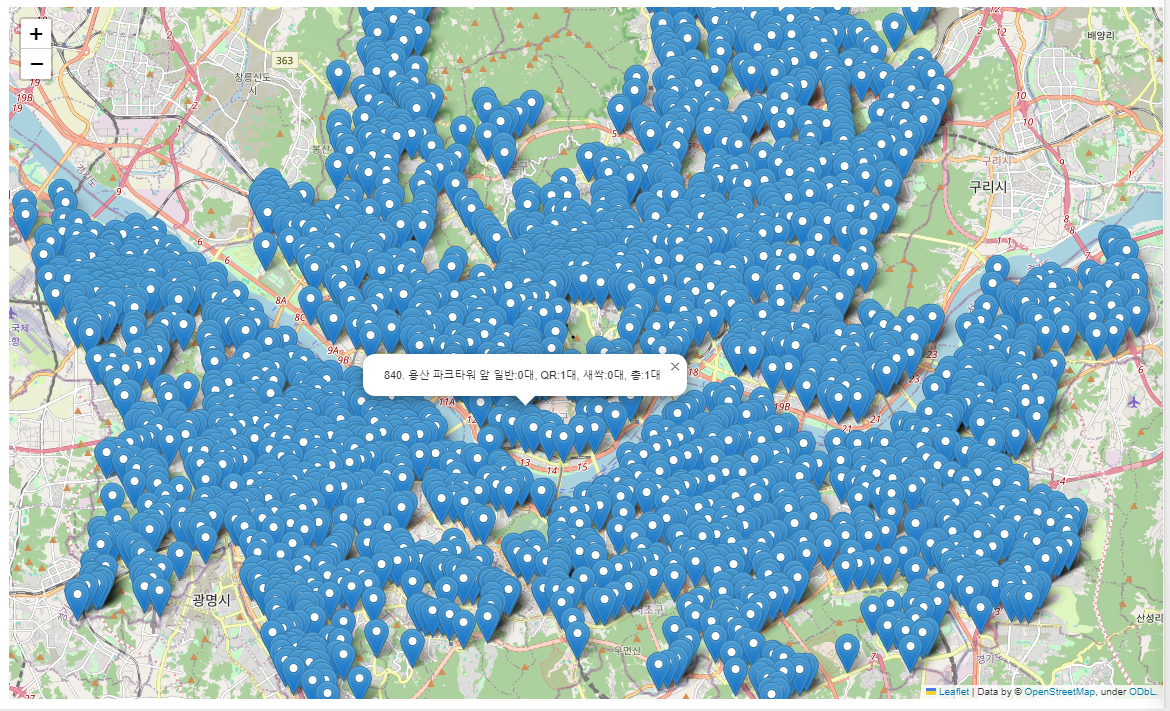
- 데이터 지도에 나타내기
# {정류소명} 일반{}대, QR:{}대, 새싹:{}대, 총:{}대
bike_map = folium.Map(location=[bike_df_map["stationLatitude"].mean(), bike_df_map["stationLongitude"].mean()], zoom_start=12)

for index, data in bike_df_map.iterrows():
  popup_str = "{} 일반:{}대, QR:{}대, 새싹:{}대, 총:{}대".format(
      data["stationName"], data["parkingBikeTotCnt"], data["parkingQRBikeCnt"], data["parkingELECBikeCnt"], data["total"]
  )
  popup = folium.Popup(popup_str, max_width= 500)
  folium.Marker(location=[data["stationLatitude"], data["stationLongitude"]],
                popup=popup).add_to(bike_map)

bike_map
'Python > 데이터분석' 카테고리의 다른 글
| Python 떡볶이 프렌차이즈 입점전 (0) | 2024.06.03 |
|---|---|
| Python 전국 도시공원 데이터 (0) | 2024.05.28 |
| Python seaborn, folium, 상권별 업종 밀집 통계 데이터 (0) | 2024.05.28 |
| Python 가상 온라인 쇼핑몰 데이터 (0) | 2024.05.28 |
| Python MatPlotlib (0) | 2024.05.27 |